

 Facebook
 X
X
 Pinterest
 Copy Link
Every spring, the real estate industry braces for the seasonal rush — more listings, more buyers, more activity. Q2 2026 had the inventory side of that equation. What it didn’t have was the buyers to match.
Here’s what the data actually shows — and what it means if you’re thinking about buying or selling in Orange, Rockland, Sussex, or Passaic County.
The National Picture: Prices Keep Climbing, but the Pace Is Slowing
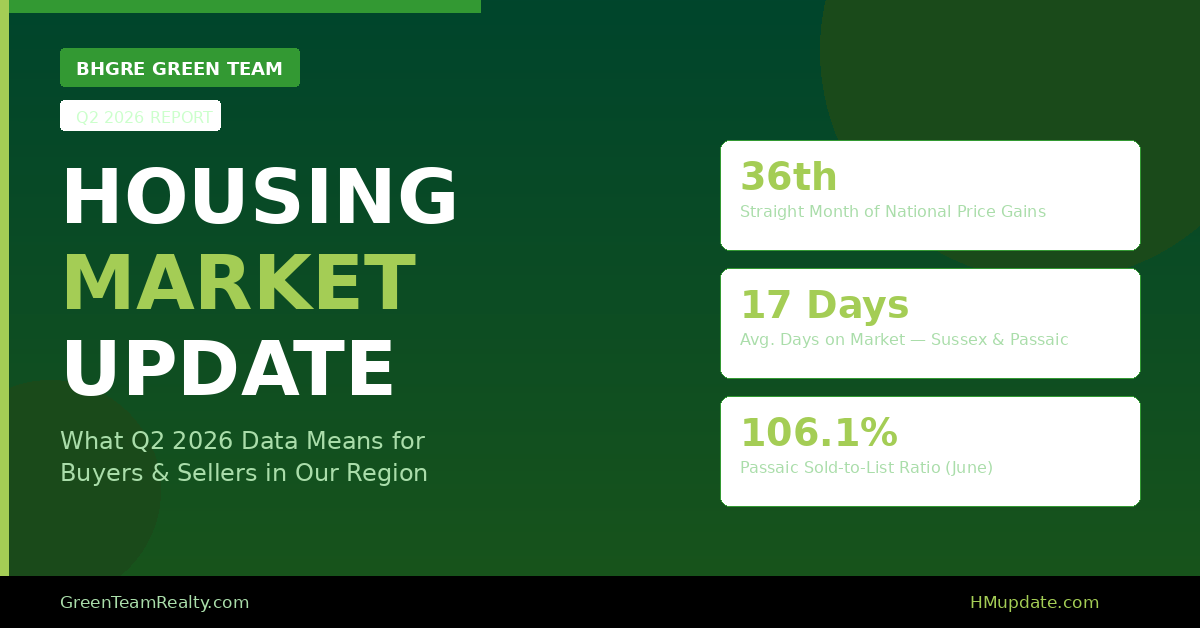
Nationally, the housing market is showing signs of gradual stabilization heading into the second half of the year. The median existing-home price reached $440,600 in June — up 1.8% year-over-year and the 36th consecutive month of price gains. Prices are not falling. But the pace of appreciation has cooled considerably from the frantic years of 2021–2023.
The 30-year fixed mortgage rate closed Q2 at 6.49% and has since pushed higher, climbing to 6.83% by late July — driven in part by renewed oil price pressure from Middle East tensions. Forecasters at Fannie Mae, the MBA, and Wells Fargo are projecting rates to hold in the mid-to-upper 6% range through year-end.
For buyers, rates above 6% continue to create a real affordability ceiling. For sellers, that same rate environment is keeping some would-be move-up buyers locked in place — which constrains supply even as new listings increase.
One bright spot nationally: the NAR Affordability Index rose to 102.3, up from 95.5 a year ago. Incomes are slowly catching up. The market isn’t out of reach — it’s just not easy.
Our Region: Competitive, Fast, and Seller-Favoring
While national data sets the backdrop, the story in our four-county footprint is its own chapter — and it’s worth reading closely.
June 2026 — Local Market at a Glance:
| County | Median Sold Price | Inventory | Sold-to-List | Days on Market |
|---|---|---|---|---|
| Orange County, NY | $470,000 | 4.95 months | 100.2% | 38 |
| Rockland County, NY | $800,000 | 3.51 months | 100.9% | 28 |
| Sussex County, NJ | $460,000 | 2.71 months | 103.0% | 17 |
| Passaic County, NJ | $610,000 | 3.1 months | 106.1% | 17 |
Source: RPR® Local Market Data
A few things stand out here.
Passaic County, NJ ended Q2 as the region’s most competitive market — buyers there paid an average of 106.1% of asking price in June, and homes sold in just 17 days. That’s not a buyer’s market by any measure.
Sussex County, NJ mirrored that pace, also closing at 17 days on market and 103% sold-to-list. Supply never crossed 3.1 months of inventory all quarter, keeping conditions firmly in seller territory.
Rockland County, NY is the premium market in the footprint. A $800,000 median sold price in June, homes selling in 28 days, and buyers consistently paying above asking — Rockland remained tight and competitive throughout Q2.
Orange County, NY shows the most balanced conditions of the four. Inventory climbed toward 5 months of supply — approaching balanced-market territory — but days on market actually fell sharply through the quarter (from 58 in April to 38 in June), and the sold-to-list ratio crossed back above 100% by June. The data here tells a nuanced story: the market softened from its peak, then showed real resilience.
What This Means If You’re Thinking About Making a Move
If you’re a seller: Conditions remain favorable across all four counties. Homes priced correctly are selling quickly and, in most cases, at or above asking. The window is real — but so is buyer sensitivity to overpricing. Presentation and pricing strategy matter more than they did in 2021.
If you’re a buyer: You’re competing against less competition than the pandemic years, but you’re not in a buyer’s market. Rates are the primary variable working against you right now. Getting pre-approved and knowing your number before you start touring is more important than ever.
If you’re on the fence: The Fannie Mae Home Price Expectations Survey projects home prices to continue rising through 2030 — even under pessimistic assumptions. Waiting for a dramatic price drop may mean waiting through continued appreciation.
Looking Ahead: Q3 2026
The U.S. housing market enters Q3 in a period of gradual stabilization. Price growth is slowing to low single digits, rates are holding near 6.5%, and inventory is slowly improving — though still below pre-pandemic norms. Sales are rising modestly, affordability is edging in the right direction, and the market is shifting toward greater balance between buyers and sellers.
Our local markets, given their tight supply and strong demand fundamentals, are likely to remain competitive even as the broader national market finds its footing.
Want the Full Picture?
We’ve put together a complete Q2 2026 Housing Market Forecasts brochure that includes:
- National housing forecasts for the second half of 2026
- State-level appreciation trends for New York and New Jersey
- County-by-county local market data with plain-language takeaways
- The Fannie Mae Home Price Index and mortgage rate forecast charts
Each month, our team also produces a 15–20 minute Housing Market Update video covering the full data picture for Orange, Sussex, and Passaic counties. You can find the latest one at HMupdate.com.
If you have questions about what any of this means for your home or your next move, I’m happy to have that conversation. Whether you need a data-driven market analysis, a lender referral, or just a straight answer — reach out.
If you already have a Realtor you’re working with, please bring this to them. If you don’t have one and would like guidance, our team is here.


